How to Make a Kickass Scientific Presentation with LibreOffice and Other Free Tools
18 Apr 2015First of all, you’ll need to develop an interesting scientific research program, come up with some novel results, then organize them into a coherent set of ideas to present. Ok, done? Great! Now here are some tips on making that into a modern, professional, and clean set of slides using only free tools.
As a preview, here’s the software discussed in this post:
This post is not meant to be an exhaustive list, just a collection of some not-so-obvious tricks which might help convince you that LibreOffice can really be a powerful alternative to other paid and free presentation software, including PowerPoint, KeyNote, and Beamer.
1. Use SVG figures
Most science presentations will include lots of plots, and to look nice on any screen resolution, you’ll want these to be vector graphics like PDF or SVG rather than raster images like PNG or JPG. Technically, LibreOffice supports inserting PDF figures, but in my experience support is shoddy. Fortunately though, SVG support seems to be excellent. So stick with all SVG figures in your slides.
1.1 Use pdf2svg
If you want to show a figure which you have only in PDF format, pdf2svg does a great job converting to SVG. Once you have the program downloaded and installed, the syntax is simply,
pdf2svg input.pdf output.svgpdf2svg is especially powerful because it converts fonts in the original PDF to vectors, so your SVG will have no font dependencies (which LibreOffice might otherwise have a chance at screwing up).
1.2. Doctor your SVG figures with Inkscape
Inkscape is a really great free vector graphics editing tool which can do many more useful things than I have room to list here. One feature which anyone can learn in about five seconds is the ability to delete parts of figures. A good rule of thumb for giving talks is,
Don’t give your audience a chance to get caught up by an irrelevant piece of information.
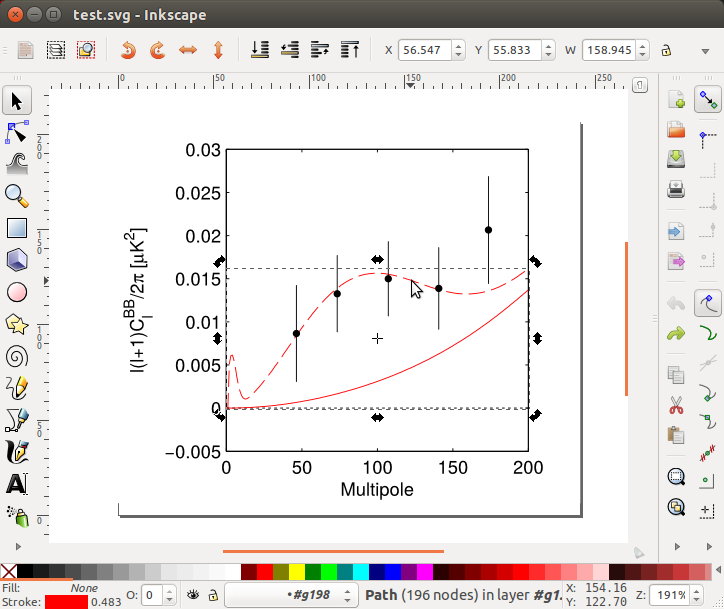
In practice, this often means that you have a plot you’d like to show which conveys many ideas, but only some are important to your talk. You could show the figure and just tell your audience not to pay attention to certain parts, but even better, with Inkscape you can just delete them. Its as easy as opening up the SVG file, clicking on whatever line, point, text, etc… and hitting the delete key. Then save back to SVG, and you still have a clean, vector graphics file which can be included in your slides. Of course, you can do lots of other more advanced things to the figure, depending on your Inkscape-fu.
An example of what editing a figure (from a recent paper) might look like:

1.3 Extracting a figure as SVG from a PDF article
If you have only a PDF article in which the figure appears, you can still cleanly extract the figure as an SVG.
First, however, check that figures for the article aren’t available separately. For example, for most papers on the arXiv, you can download the figures individually by clicking Other Formats under Download and selecting Download Source. Many journals offer similar options as well.
If nothing like that exists, then do this,
-
Extract the page where your figure is from the PDF and convert it to SVG all in one step by doing
pdf2svg input.pdf output.svg [page](where[page]is the page number) -
Open the SVG in Inkscape, and follow these instruction to delete everything but your figure then these instructions to resize the canvas around it. Basically, the steps are,
- Use the rectangle tool (hit R) and draw a rectangle on top of the part of the page you’d like to crop out.
- Select all (Ctrl+A)
- Select Object→Clip→Set
- Select File→Document Properties, then on the Page tab expand the Resize Page to Content section and click on Resize Page to Drawing or Selection.
1.4. A note on Matplotlib (and maybe other plotting software)
If you are making your own plots in Matplotlib, you have the option of saving directly to SVG. In practice, I have found that saving to PDF then running pdf2svg on the file produces more consistent results (the problems are usually font related, or lines not being clipped correctly). I usually run this directly from Python with,
#...generate plot...
savefig('fig.pdf')
os.system('pdf2svg fig.pdf fig.svg')
If your other plotting software has the option to save to SVG but seems to be encountering problems, check if this doesn’t resolve things.
2. Including Latex equations
Many scientific presentations tend to include equations, and for equations Latex rules the land. Including Latex equations in your LibreOffice presentation is extremely simple with the Texmaths Equations extension. To install it, download the file from the link, then from LibreOffice go to Tools→Extension Manager, click Add, and select the file you downloaded. Once installed, Texmaths Equations adds a button to the LibreOffice toolbar, which, when clicked, lets you type in arbitrary Latex which is instantly rendered to your slide.
2.1. Inline Latex (sort of)
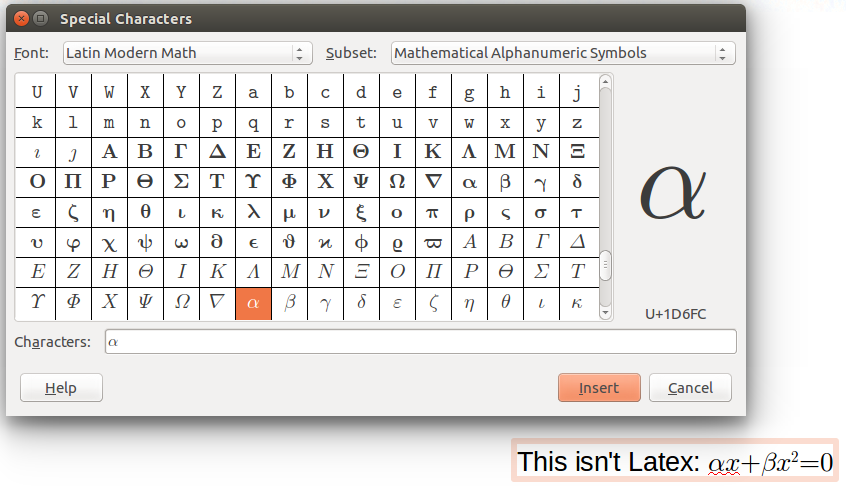
Texmaths Equations is great but the equations cannot be interspersed with text inside of a text box. A limited way to fake this is to convert parts of the text in text boxes to the same font that Latex uses to render equations, the Latin Modern Math font. This will let you write variable names, super and subscripts, and simple numerical equations that look like Latex.

Note that for alphanumeric variables, Latex equations use the characters under the “Mathematical Alphanumeric Symbols” Subset of the font, which can be accessed by going to Insert→Special Character in LibreOffice.
3. Exporting to PDF With Transitions
For sharing your slides with others in a portable format, LibreOffice has the option to export to PDF. However, if your slides had transitions, these can be lost in the conversion. This isn’t just an aesthetic problem, it can actually make your presentation illegible if you had objects appear on top of other object; the PDF will only feature the final version of the slide and some of the content could be completely covered up.
Fortunately, the Expand Animations add-on can take a slide with transitions on it, and expand it to several PDF slides. For example, if your slide had objects A, B, then C appearing one by one, the expanded PDF will now have three copies of that slide where A, then B, then C appears.
To install, download the file from the link, then from LibreOffice go to Tools→Extension Manager, click Add, and select the file you downloaded. You will now see the Expand Animations option under Tools→Add Ons.
4. Conclusion.
If you made it this far and want to see some examples where I make use of all of the above tips, check out some of the slides from my talks (this is a good example). And if you have any other suggestions for using free software to create scientific talks, please let me know below!